Illuminance

Distribution

Written by:
Camrin Petramale & Neil Adamson
Manufacturers love comparing their lights to industry standards – especially when it comes to claims about brightness. Unfortunately, these claims come from each company’s own standards and lack uniformity across the industry. Additionally, output alone cannot provide a true understanding of a fixture’s characteristics. Through this series, we will examine the elements to consider when making output comparisons, beginning with Illuminance Distribution.
The brightness of a light is initially derived from the measure of luminous flux and its distribution (Figure 1). Luminous flux describes the amount of light energy created, measured in lumens and more commonly referred to as a source’s intensity.
The problem is while two lights may create the same amount of light, if one concentrates all of that light into a small area, and another distributes it evenly across a space, each fixture will produce significantly different light levels when measured at the same distance (Figure 2).
Figure 1
An electrically charged gas or semiconductor or a heated material creates light energy – referred to as luminous flux (lumens). How that energy is handled is the duty of the light fixture. All manufactured fixtures begin with a source which is usually controlled using a reflector and a front element, such as a lens or diffusion panel. Intensity is a fixed quantity of luminous flux that the source is able to create. Illumination is the luminous flux measured across a defined surface area – Lux uses 1m² whereas Foot-candles uses 1ft². Because this surface area never changes, when the light spreads out over distance, less of it covers that same surface area. This means that Illumination will decrease over distance, but intensity will never change – unless the power level changes (dimming). Candela measures the lumens across the angular span of one steradian of a sphere, with the center of the sphere being the origin point of the light source.

Alone, the lamp will radiate light evenly in all directions (isotropically) and produce a measurement of 204 Lux at 5 meters.

Figure 2
An 800 watt Joker HMI lamp emits 64,000 lumens.

When placed inside a housing and given a reflector, that same lamp will distribute light differently (directional) and will produce a measurement of 60,000 Lux at that same 5' meter distance.

There are different factors that impact how a fixture’s light is distributed, and those factors will also influence other characteristics such as illuminance and falloff. These are important elements to consider when choosing a light, but we will first look at distribution’s effect on characteristics known as punch, wash and throw. Each of these characteristics are quantifiably associated with a luminaire’s beam angle, field angle and slope angle. These measurements all concern the concentration of light across an angular span.
Measuring this concentration across a planar surface area helps add even greater practical context. This group of measurements is referred to as the Planar Illuminance Distribution table and is most clearly represented by graphing those measurements into a curve. While some manufacturers will offer measurements of their fixture’s planar illuminance distribution, they each use different scales and methods, making comparisons between different fixtures unreliable. We decided to conduct our own test that would level the playing field across all fixtures, adding important context and supplementing various brightness measurements.

3 Characteristics of an Illumination Distribution Curve

  1. Beam Spread: How wide is the Beam Angle?
  2. Edge Definition: What is the ratio of slope angle to beam angle? The greater the ratio, the more defined the beam edge is.
  3. Uniformity: How smooth is the curve? Does it have multiple Spill and Edge Peaks? Is there a visible spike across a narrow angle? Is there a relatively even illumination level across the beam and field area boundaries? The Beam Angle?

Throw, Punch & Wash: Quantified

Throw: A smaller beam angle AND a smaller slope angle mean that more of the luminous flux will be efficiently focused with a defined beam edge and the size of that beam spreads out gradually over a far distance. This will provide greater illuminance at far distances.
Punch: A smaller beam angle BUT a larger slope angle mean that there is high illuminance in the center of the beam, also known as a hot spot, but that there is no defined beam edge. The result is light that can illuminate a larger area, but with a very bright center focus region that remains small, producing more uni-directional shadows from a single origin.
Wash: A larger beam angle AND a larger slope angle mean that illuminance is very evenly spread out across a wide area.

Testing

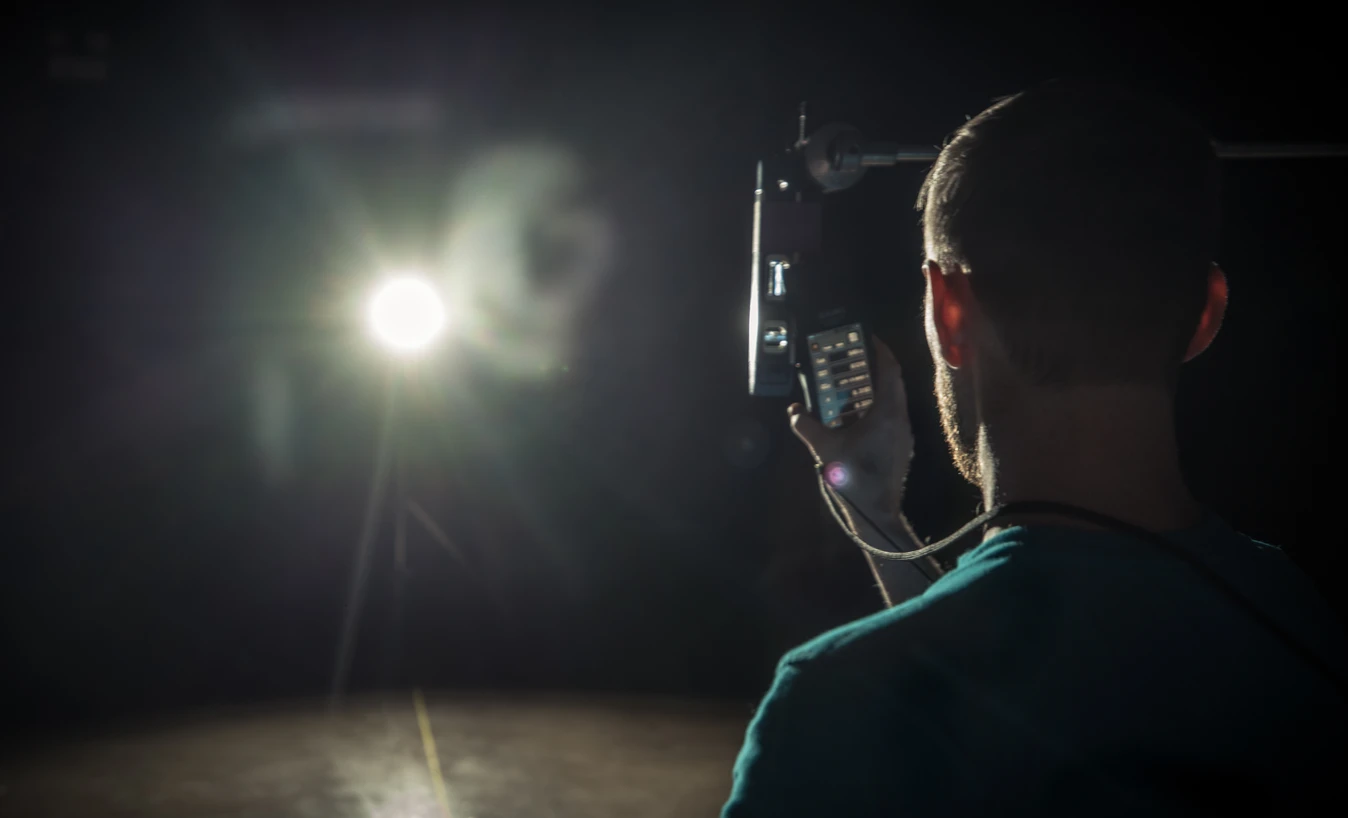
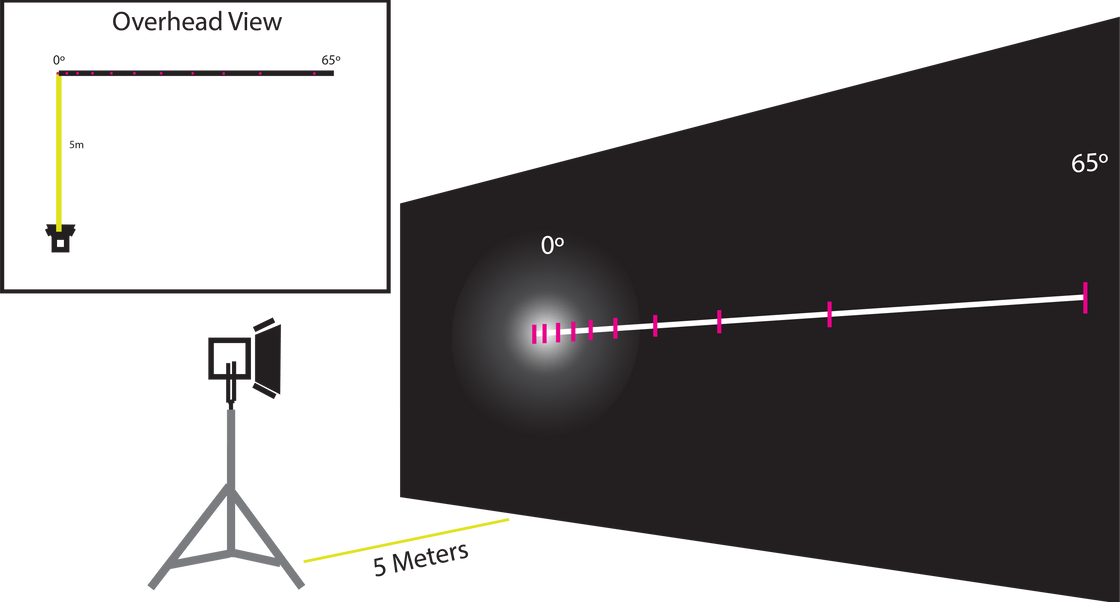
Placing a light 5m from a measurement plane, we gathered 15 separate, angle-targeted readings from the center of the beam down the plane to the right along the horizontal axis. While a more comprehensive test would include the vertical axis as well, most of the light fixtures had circular front elements, meaning that their beam spread should be relatively similar along both the horizontal and vertical axes. It is important to note that these curves do not apply to the vertical distribution of illuminance on fixtures with square and rectangular front elements, only to their horizontal distribution.
Although manufacturers perform a similar test to convey illumination distribution, there are three key differences in our method.
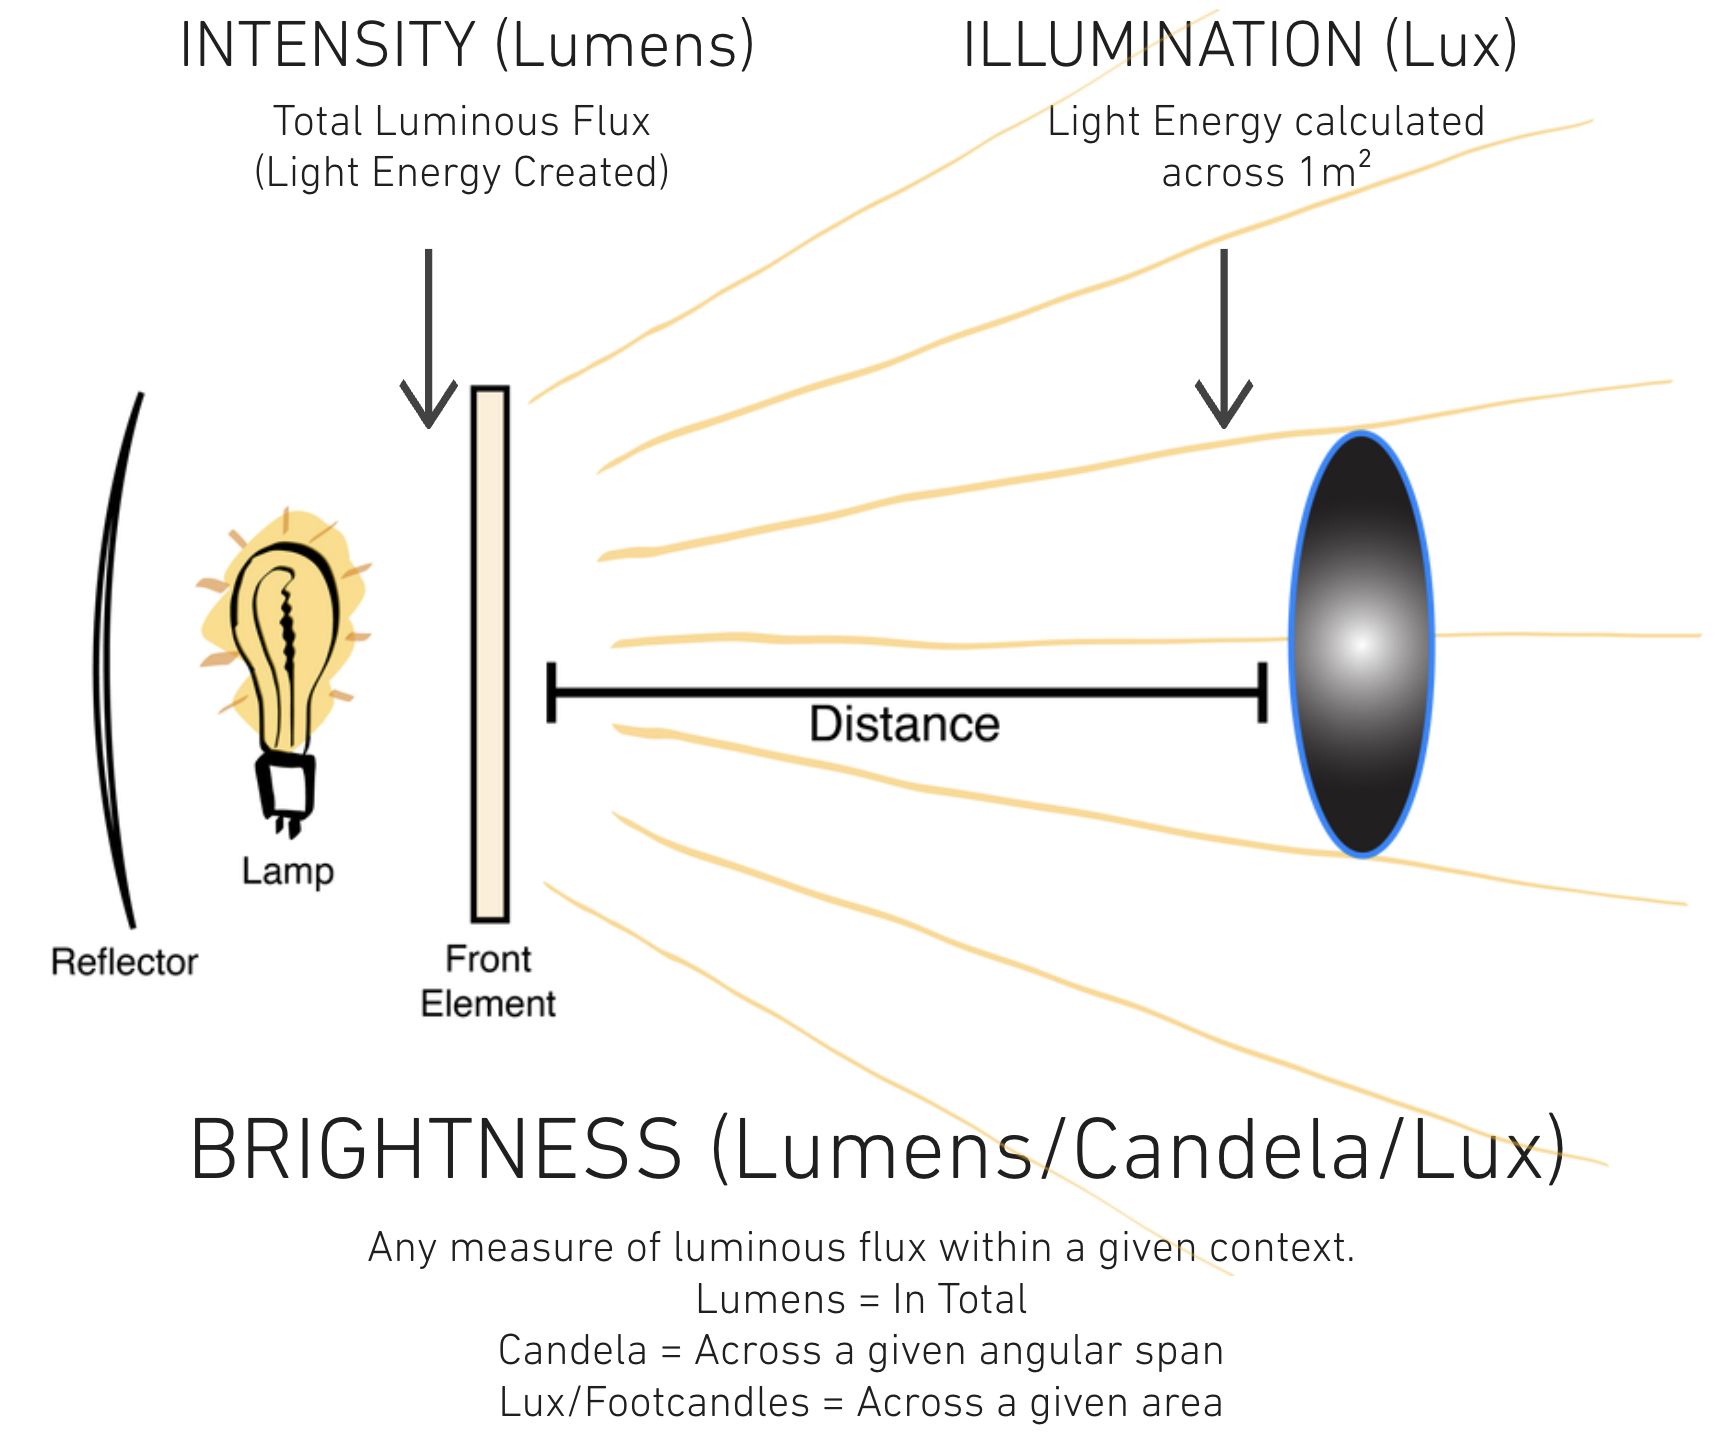
Manufacturers measure with candelas because this makes calculating the output at any distance easier. However, this method is only concerned with measuring a small area of the beam. While useful for calculation purposes, candelas prove to be useless on-set. Instead, brightness is measured by illuminance over an area and is this is what our incident light meters are measuring and approximating. Therefore, while it adds another variable into calculations, we felt that it was important to present results based on illuminance, in Lux. This of course requires a constant distance at which to take all measurements. We measured all sources at a 5 meters planar distance because at this distance, the falloff rates for the lights tested have roughly evened out to give a more equitable representation of intensities. Increasing the distance beyond 5 meters would have introduced spill and ambient bounce, skewing the readings.
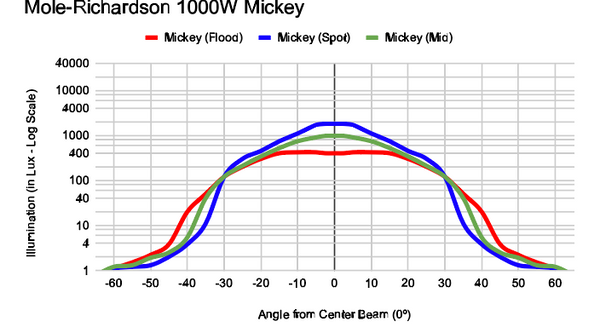
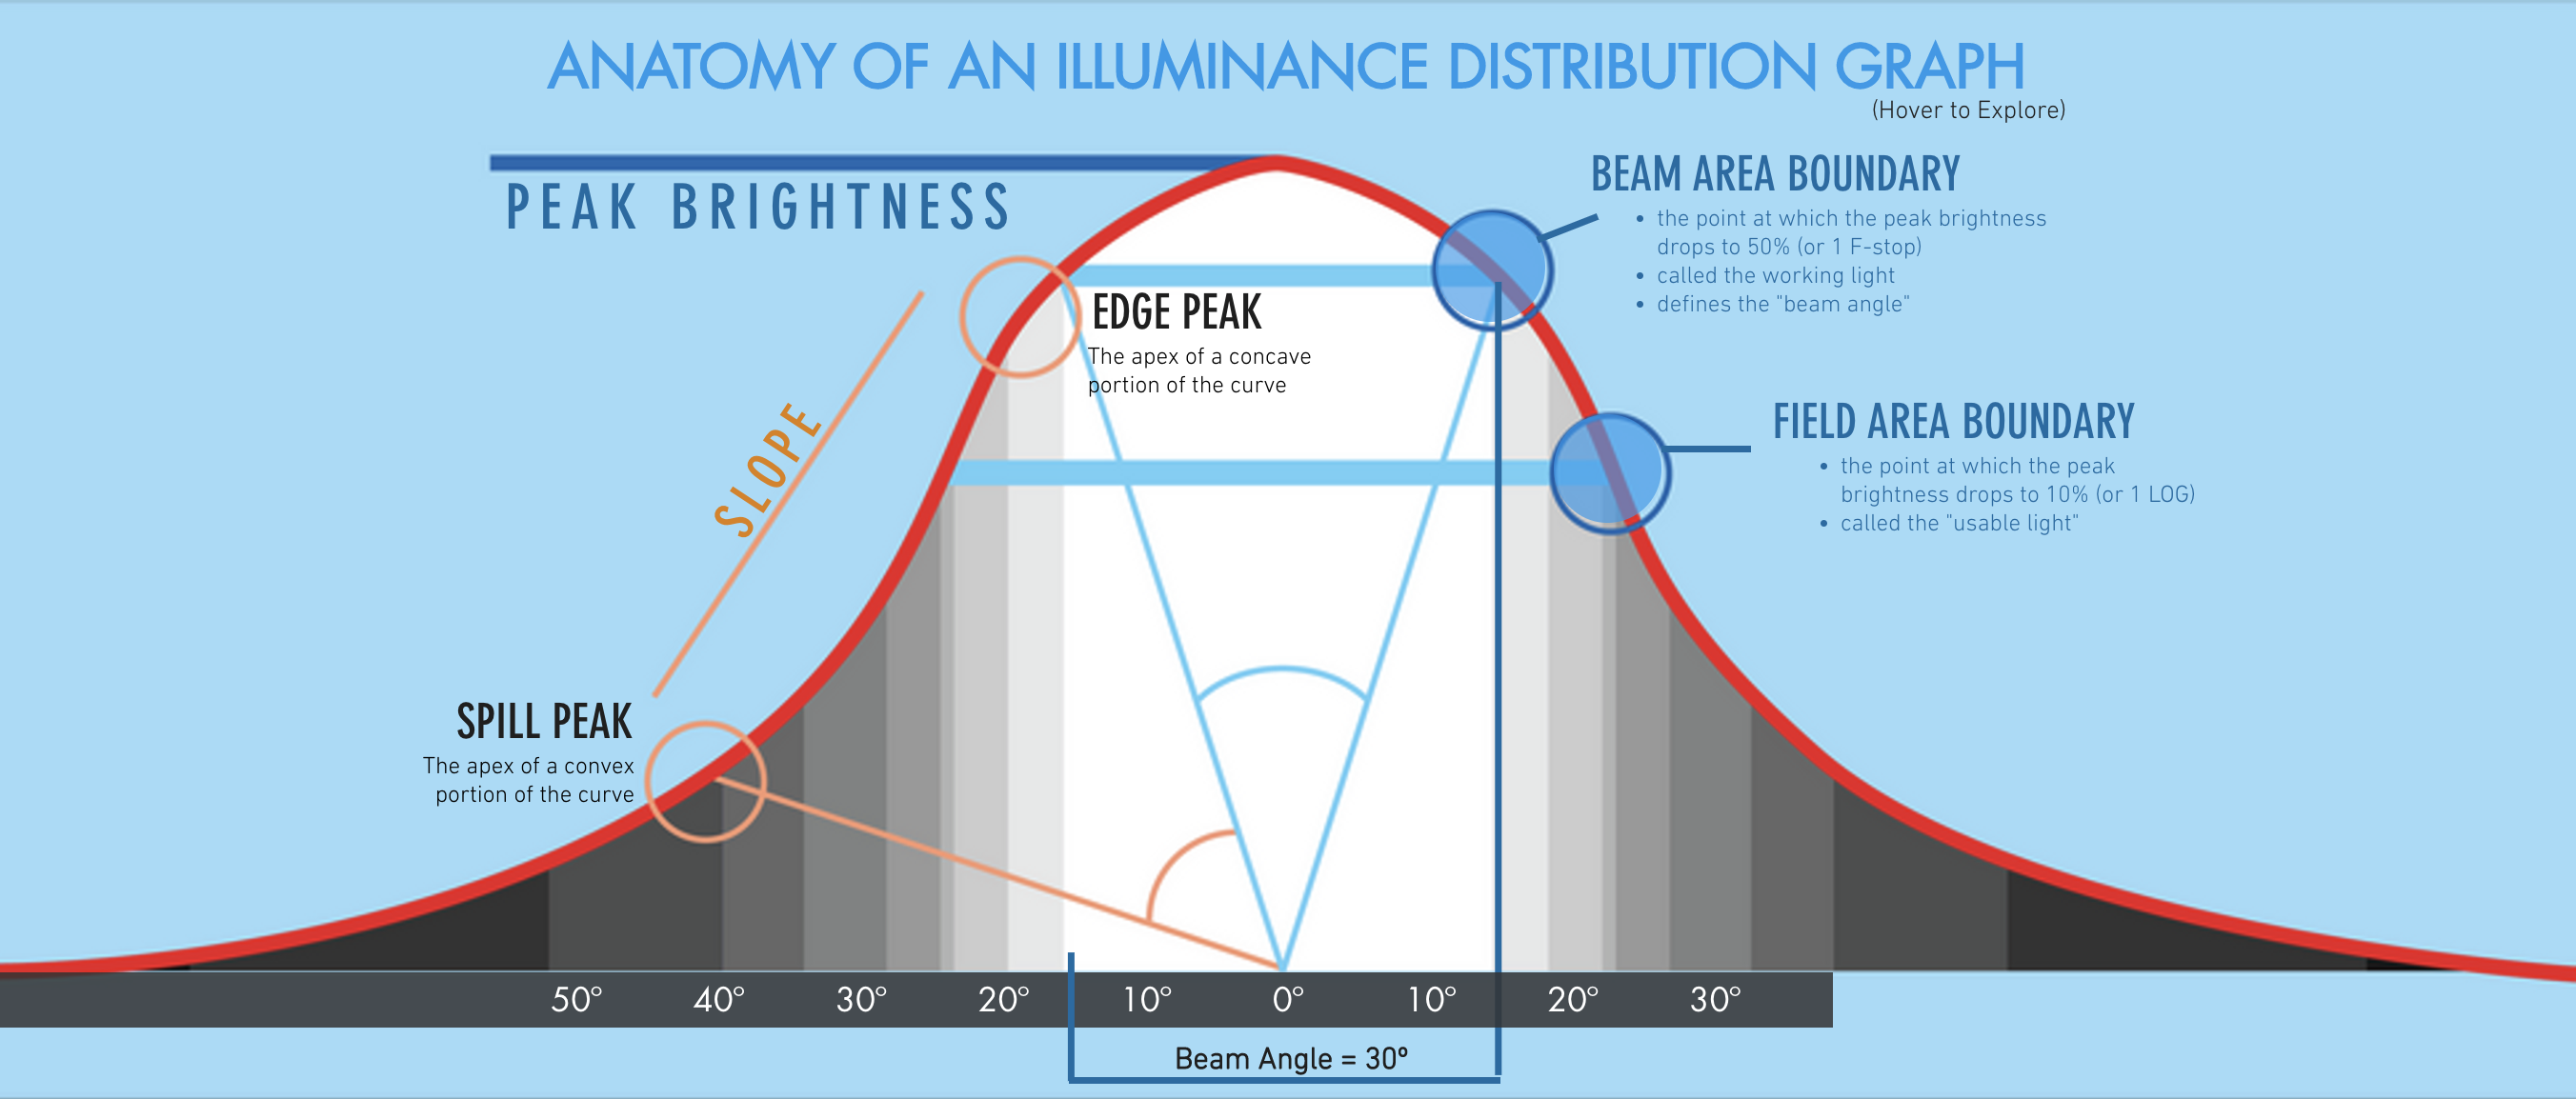
Additionally, while the x-axis of all distribution graphs always denotes the angle from center beam, manufacturers measure take their angle measurements isometrically (at an equal distance from the center of the light), however, we choose to measure along a planar surface. Planar measurements yield the most practical results for usage in our industry (shooting through diffusion, bouncing, washing cyc walls, etc). This meant that not only did the angle change with each measurement, but the overall distance from the source did as well. This has clear effects on fixtures with specified beam angles. For instance, a 19º Leko lens measures half of its peak brightness at 13º when measured along a plane. This adds more work by our calculator to determine beam spread, but is much more useful for how the motion picture industry uses lights.
Figure 4
Pink lines/Dots show approximation of points of measurement along the 5m plane. In total, 15 separate measurements were taken from 0º to 65º. Measurements were only taken from the center of the source moving away to the right along a horizontal plane. Lamp left measurements are symmetrically identical and denoted by a negative angle in the graphs.
Figure 5
Isometric distance measurements are performed along an angular span, maintaining the same distance from the angular point of origin at all times. Planar distance measurements are performed along the same angular span but along a fixed plane, perpendicular to the line connecting the angular point of origin and the center point of the plane. Planar distance measurements are not equidistant to the primary measurement distance.
Lastly, the y-axis of all distribution graphs measures brightness. Manufacturers will either use actual measurements (in candelas) or “relative intensity” (where 100% is the peak brightness of the fixture). Relative intensity is more helpful for beam pattern comparisons. However, because both a camera and our eyes see light logarithmically, the y-axis must logarithmically scaled for such a comparison to be useful. Our graphs scale the y-axis logarithmically, whereas manufacturers do not.