

We are given certain numbers to grade a light’s “ color quality”, but what is the grading criteria? What are these numbers measuring? Since quality is such a subjective opinion, measurements should instead be made quantitatively. It is important to understand what these numbers are actually measuring in an attempt to create a standard for “quality”.
First, we must quickly discuss what color is. This seems obvious, but since “color” is such a broad term, let’s focus on a commonly discussed, but often misunderstood aspect of color: hue. When we think of hues, we often picture an HSI wheel. If you look at the spectrum of visible light diagram, it is clear that the outside colors on an HSI wheel line up with the colors on this diagram. However, there is one noticeable exclusion: magenta.
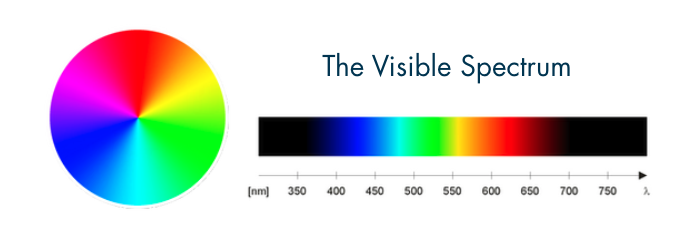
From red to blue, there is a large range of colors that don’t appear on the spectrum – the purples. This is because while we know that purples are all around us, they don’t actually represent a wavelength range on the spectrum of visible light. Instead, because we have 3 cones to detect color in our eyes, our eyes assign the color purple to things that reflect long and short wavelengths but NOT medium wavelengths.
Normally, our brains blend the mixture of light that our cones detect to find the colors in between the primary colors of Red, Green and Blue:
Long + Medium = “Medium-Long”
Short + Medium = “Medium-Short”
Going by the visible spectrum and this method, you would expect that detecting Long + Short , the mind would assign Medium because it exists in between the long and short wavelengths. But if the Medium cone detected nothing, then the mind must assign a different color – something “artificial” and so, it creates Magenta …the “bizarro-green.”
In fact, none of the colors that we perceive actually represent reality. They are simply a way for our brain to assign values to different combinations of wavelengths that we detect. Even the colors that are overlaid onto the visible spectrum diagram are simply a psychological translation of a collection of wavelengths in different quantities detected; they are not absolute.
This is important to understand because a camera system functions by attempting to mimic the same detection of wavelengths as the human vision system. It then attempts to transform those wavelength detections into the same collections –or colors– as the human brain does. Mathematical color spaces have been created as an attempt to translate wavelength detection to our perception.
Some of these systems are more useful in mathematically mapping color and making adjustments, while some are more useful when it comes to visualization. However, they are all subject to the values that are input. A camera inputs these values through sensors that respond to Red, Green and Blue light, similarly to the cones in a human eye. These inputs define the gamut, or outermost boundary of the color space. The gamut encompasses the entirety of all available colors in a color space and those inputs are used as “dials” on a fixture that can be tuned together in combinations to create any color within that space. Different color spaces have different inputs that exist in different locations on each color space. For example, a standard RGB color space has 256 degrees on each dial that combine to create white light when all are set to 255 (0 counts as a degree), and can create 16,777,216 different colors within the Rec. 709 / sRGB gamut. While a camera sensor’s RGB channels may be similar to the RGB cones in a human eye, because they exist at slightly different locations in each other’s color space, the same color may require different mixing to achieve in one system, or worse, may not be possible to create in that system at all. This is known as existing outside the gamut of the system. The variations between the spectral sensitivity of a camera sensor and a human eye can make a huge impact on how colors appear on camera.
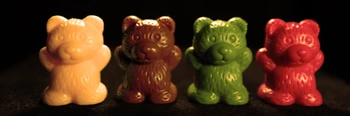
Making matters worse, different light sources reflect different wavelength combinations off of the surface of identically colored objects — rendering different representations of those colors in both the color space of the human vision system, and the color space of a camera system. This phenomenon is known as metamerism, and is not only the greatest hurdle in recreating color, but also a core tenet of how we measure a light’s fidelity.
One goal in cinematography is to recreate human perception of color. To do so, we must be able to understand the differences in how technologies interpret color. This requires some way of measuring any metamerisms within the color space that we are working in, and also understanding how to read those measurements to create the desired look.


A collection of Metamerisms. Whether the color space is given the wrong white point from which to calculate (wrong CCT), or the fixture is outputting a narrower band of the visible spectrum, the perceived color of objects is extremely affected. Subtler differences can still present problems in post-production, or limit the creative palette. Conversely, using a metamarism to your advantage can be a creative advantage in achieving a desired look.
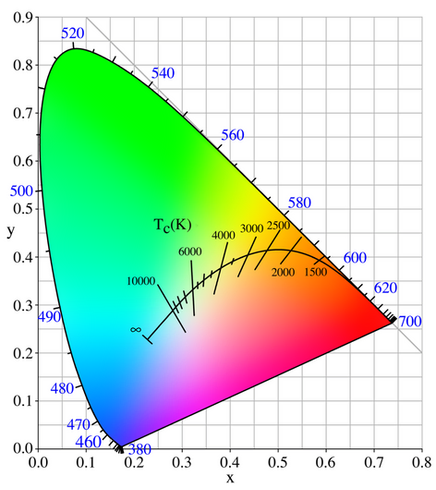
The most commonly used measurement is Correlated Color Temperature or CCT. CCT maps out the locations of the white point of “full spectrum” light sources. This is to say, to a human vision system, the point that has no visible shift towards any hue. Because the human vision system is psychologically based, our brains are constantly reinterpreting color space to focus around this point. Therefore, it is dynamic. In an effort to translate this dynamic point into non-dynamic color systems, Deane B. Judd transformed the Fspectral power distribution (SPD) of Planckian radiation temperatures onto the 1931 CIE x,y chromaticity diagram as a curve.
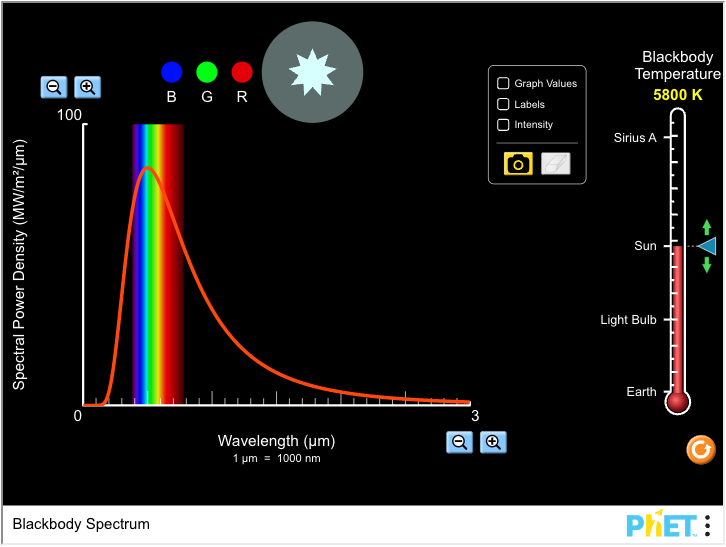
A Plankian radiation temperature tool that helps visualize the SPD of a blackbody radiator at any temperature. Adjust the temperature with the slider on the right. Use the magnifying glasses to change the scale and get a better view at how the distribution would look on a relative value based SPD.
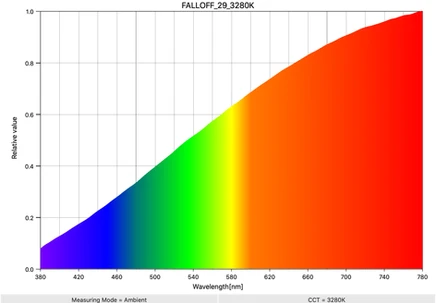
Spectral Power Distribution – commonly referred to as “spectrum” demonstrates the amount of light being output from a source (y-axis) at different wavelengths (x-axis). Above, we see the Spectral Power Distribution of a 3280Kº tungsten source that appears as white light because it outputs all wavelengths of visible light. Because there are more longer wavelengths at greater intensity than shorter wavelengths, the light appears as a more red, or Orange White. When set to 3200K, a camera will balance the spectrum evenly and treat this orange-white as the true white point – something our eyes do naturally. If set to 5600K, the camera will see the deficiencies in shorter wavelengths and the light will appear very orange.
This concept is still used today. This curve, known as the Blackbody Locus, maps the SPD of an illuminant onto the 1931 CIE color space. When the x, y coordinates fall along the blackbody locus, or “Planckian curve,” it is assigned a “correlated color temperature,” a value that correlates the assumed spectral power distribution (SPD) to be the same as that of a blackbody radiator at the same temperature. If the source does not register its x, y coordinates on the blackbody locus in the chromaticity diagram, it is said to have either a green (registers above the curve) or magenta (registers below the curve) shift. This shift is represented within the x, y system as a deviation of coordinates and is referred to as ⊿uv.
These measurements are all incredibly useful and have been in use for decades. Film stocks were built around them and gels were manufactured according to how to shift these numbers to a desired look. Because incandescent light sources ARE blackbody radiators and were the most widely used lights in film, this system was simple and adjustments were straightforward. Even HMIs could work easily enough within this system because of how full their spectrum was. Although they had possibilities of Green/Magenta (G/M) shift, most of the time, their SPDs were close enough to the average SPD of “daylight” at mid-morning and mid-afternoon that they registered the same on daylight film stocks, which were designed around the daylight SPD. However, as new “discontinuous” light sources became more widely used, the effect they could have on how a film stock, and eventually camera sensor, could interpret and render colors in a predictable manner was devastating. Illuminants such as sodium vapor, mercury vapor, commercial fluorescents, and eventually LEDs or Solid-State lighting, did not follow the Blackbody locus, or even the later developed Daylight locus. They created white light by manipulating color systems into the interpretation of being white – usually by mixing 2 or 3 more discrete wavelength collections in an equal enough manner to mathematically disguise themselves as a Blackbody source, falling somewhere on one of the now two loci. The downside to this is that how they actually reflected colors off of colored objects did not correlate to a blackbody radiator. Because the SPD was missing crucial wavelengths, so was that object’s reflected light SPD, and it now appeared as a different collection of wavelengths that sometimes landed in a very different location on the x,y chart. It was clear that more ways of judging light sources, besides CCT, G/M shift, x,y coordinates and ⊿uv were needed. With the variety of sources now in use, it has become important to give a number to a light’s overall ability to render reflected colors accurately within a given color system, also known as a light’s fidelity. But which system to use?
Since most of this previous work had all been centered around scientists studying the human vision system, this became the basis for the first system in measuring color rendering – CRI (Color Rendering Index). With the advent of the digital age, we have launched into a new era of lighting and color spaces. Now, CRI has proven to be essentially useless for reasons discussed later. In its place, there are several other indexes that seek to provide a measurement to color fidelity, and even the reflected color gamut of a source. These indexes offer measurements of fidelity in the context of either:
1) An absolute spectral distribution comparison,
2) The human vision system’s interpretation,
or
3) A camera system’s interpretation.
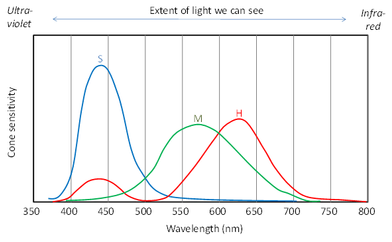
The Spectral Response of the Human Eye – Each curve represents each cone’s responsiveness to different wavelengths along the spectrum. The red cones respond mostly to longer wavelengths, the green cones to medium wavelengths, and the blue cones to shorter wavelengths. Note: Violet shows up on the short end of the visible spectrum because our red cones have slight sensitivity to shorter wavelengths in addition to their high sensitivity to longer wavelengths; yet, magenta represents no wavelengths of visible light.
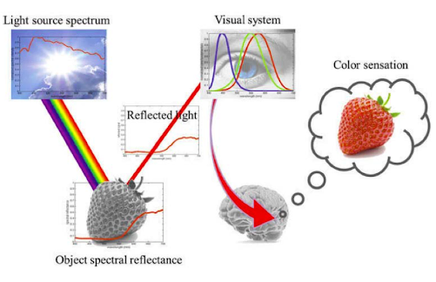
The physical, biological and psychological process of creating the experience of Color.
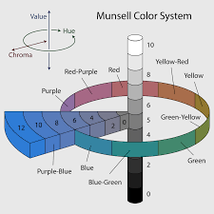
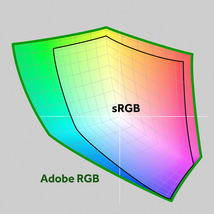
Two Well-known color spaces: The Munsell System, Used by HSL/HSI and the RGB system
Wavelengths – A measure of length of a wave of electromagnetic radiation, measured in nanometers (nm).
Color Spaces – Any mathematically constructed environment to map and translate the human interpretation of wavelengths, i.e. color.
Metamerism – A phenomenon in which the same object registers as two different colors, or two different colors register as the same color in the human vision system because of a change of spectral power distribution in the light reflected from the object.
Fidelity – An expression of how well a light source reflects the total collection of visible wavelengths that a surface material allows, i.e. how accurately a source renders the “true color” or collection of an object.
Correlated Color Temperature (CCT) – A temperature, given in Kelvin that, when a blackbody is heated to would produce white light of a certain balance of red or blue.
White point – Any point in a color space that is achieved with an equal measure of input channels.
Full Spectrum – Any spectrum with enough power distributed to the spectrally sensitive wavelengths of a human vision system that a white surface appears white to an observer.
Spectral Power Distribution (SPD) – A line graph that compares the amount of light from a source (y-axis) to visible spectrum wavelengths (x-axis). Commonly referred to as a light’s “spectrum.”
Planckian radiation temperatures – any temperature (in Kelvin) that creates light energy (visible electromagnetic radiation) when a blackbody is heated to it.
1931 CIE x,y Chromaticity Diagram – A commonly used visualization of the color space of the human vision system, minus luminance, that was created in 1931 by the International Commission of Illumination)
Blackbody Locus – A Line representation of CCT values plotted in the 1931 CIE x,y Chromaticity Diagram.
x, y Coordinates – A cartesian expression of a source’s color, plotted on the 1931 CIE x,y Chromaticity Diagram
⊿uv – The cartesian deviation of a source’s x,y coordinates from the blackbody locus.
Green/Magenta (G/M) shift – A shift of a source’s x,y coordinates off of the blackbody either above the curve (green) or below the curve (magenta).
Continuous/Discontinuous Source – Initially used to indicate SPDs that had gaps within the spectrum in which the relative value was 0, in other words, SPDs that were not “full.” Over time, as those values were raised, people continued to refer to SPDs that did not have smooth curves as “discontinuous.” If the smoothness of a curve determines continuous or discontinuous, then ONLY blackbody radiators (tungsten being the only in-use one) would be considered continuous.
Daylight Locus – A later-developed theoretical “color temperature” which approximated sun/skylight along an offset, but similar path as the Blackbody locus on the CIE chart. Various “standard illuminants” with theoretical color temperatures at 5000K, 5500K, and 6500K, named D50, D55, and D65, respectively were developed. These are more commonly used in commercial visual systems nowadays to indicate a white point.
The 1931 CIE x, y Chromaticity diagram with plotted Blackbody Locus.
While a camera system’s interpretation is the most useful, because all cameras interpret color differently, a different measurement for every system is needed. Currently we only have a measurement for broadcast cameras, therefore, we must also consider the other contexts when determining how useful a source is at accomplishing a given look — whether that is naturalism, or something more targeted.
SSI (Spectral Similarity Index)
Created in 2018 by the Academy of Motion Picture Arts and Sciences
Based on any SPD curve desired
Low to moderate degree of comparison sampling [29]
Each sample weighted by relative intensity
Very critical, does not consider degree of impact in a color space
TM-30-18
Created in 2015 by the CIE (International Commision of Illumination) and IES (Illumination Engineering Society)
High degree of sampling [99], uniform color space coverage, variety of real-world objects
Reference illuminant: Blend of Blackbody locus and Daylight locus – Daylight at 5500K and above, blends from 5500K to 4500K, Blackbody at 4500K and below
Reference color space: CAM02-UCS; most uniform color space, CCT does not effect color coordinates
Considers fidelity AND gamut of reflected sources
Hard for manufacturers to “cheat”
CRI (Color Rendering Index)
Created in 1976 by the CIE (International Commision of Illumination)
Very low degree of sampling [8+6], only calculates 8 (Munsell samples) for index score, no samples at high or low chroma/lightness
Reference illuminant: Blackbody locus below 5000K, Daylight locus above 5000K
Reference color space: Munsell color system
No gamut consideration, only fidelity
Easy for manufacturers to “cheat” and aim for high sample rendring only
TLCI (Television Lighting Consistency Index)
Created in 2012 by the EBU (European Broadcasting Union)
Only based off an average of 9 3CCD broadcast cameras, not cinema cameras
Lower degree of sampling [24] based on Macbeth color chart.
Reference illuminant: Blend of Blackbody locus and Daylight locus – Daylight at 5000K and above, blends from 5000K to 3400K, Blackbody at 3400K and below
Reference color space: CIE 1976
Illuminant can be blackbody radiator, Daylight illuminant or any other tested source
Only useful for comparing multiple sources.
Because camera systems attempt to respond like tungsten and daylight film stocks which were designed around standard illuminants (D55, 3200K Blackbody), this can offer an idea of fidelity in the context of a digital camera system but does not account for the camera system’s unique rendering of wavelength collections into a useful color space.
Because camera systems attempt to respond like the human vision system, this can offer an idea of fidelity in the context of a digital camera system but still does not account for the camera system’s unique rendering of wavelength collections into a useful color space.
Ideal – if test pertains specifically to the camera being used.

CRI is useless. Never pay attention to it again. We have included it for reference only.
+90 TM-30Rf and +95 TM-30Rg indicates high reliability, regardless of camera system, due its basis in the human vision system. Yet, not absolute; cameras will see things differently so if a color is important, you must do camera tests.
+100 TM-30Rg when working with highly specular, saturated surfaces, like brightly-colored cars. The gamut of reflected colors being represented expands as surface textures become more specular and less diffuse.
+85 SSI when comparing multiple sources for simultaneous usage
+90 TLCI for potential reference. Consider if camera falls into broadcast category, if not, this number doesn’t mean a whole lot.
Test and plot x,y, and ⊿uv for CCT & G/M shifts along/off planckian curve – important when matching fixtures and white balancing a camera.
Test the fixtures gamut if light is RGB to determine the range of colored light that the source can can create. This is especially useful if using theatrical colored light.
Avoid RGB, HSI to match lights
Conduct camera tests with lights
The most important resource is usually analyzing the SPD and looking for deficiencies. Areas with deeper troughs will still render, but may not match reference sources; may also perform even worse at lower intensities; ultimately offer less freedom in the post-production color grading process in that hue range.
All sources will present differently at different intensities – especially RGB, RGBW LEDs which have limited voltage increments to accomplish computational mixing. A fuller spectrum is always better when it comes to white light.
Adding additional LEDs with different wavelength output can help fill the spectrum. However, narrower bands, such as additional colored LEDs (Lime green, Cyan, Rose Red, Amber, etc.) do not offer much improvement in white light fidelity. Additional wider band LEDs (warm white, cool white, neutral white, etc.) do offer an improvement in white light fidelity.
Adding additional narrow band LEDs can increase the gamut of colored light that the fixture can create.
Bi-colored Fixtures with only “warm white” and “cool white” LEDs do not follow the planckian curve as the color temperature is changed. If the “full daylight” and “full tungsten” readings land on the planckian, every color temperature in between will present with a magenta shift.
There is no way to guarantee that a specific camera will respond to a given fixture the way the cinematographer desires unless camera tests with that fixture are performed, so it is crucial that all values and measurements are considered within the context of usage. If a source scores poorly in several measurements, but very well on SSI of a practical source that has been decided will play heavily into the mood of a scene, that fixture would be a much better choice to use to mimic that setting than another fixture which has higher measurements elsewhere, but not in SSI. If the production design involves a good deal of glossy, saturated set decoration, TM-30 Rg should be paid attention to more. Shooting a documentary on 3CCD broadcast cameras? TLCI is most likely the most important measurement for you. Lighting an underwater dream sequence with theatrical blues and greens could mean choosing fixtures with less deficiencies in the cyan wavelengths — even if their white light fidelity isn’t high. Every different scenario offers different solutions and what is important is that measurements are not used as a grading system to judge how “good” a light is overall, but instead, they are used as indications of which tool is the right one for the job at hand.

Eleven04 is Chicago’s premier camera and lighting rental house, providing professional cinema equipment and technical expertise to independent and commercial productions since 2016. As a true one-stop shop in Chicago’s film community, we offer comprehensive production solutions including camera packages, lighting equipment, grip trucks, expendables, delivery services, and local crew support. With our 8,500 sqft facility and commitment to exceptional service, we make productions easier for filmmakers throughout the Chicagoland area.
© 2025 Eleven04 | All Rights Reserved